
File:BernoullisLawDerivationDiagram.png
BernoullisLawDerivationDiagram.png (790 × 370 像素,檔案大細:9 KB ,MIME類型:image/png)

|
File:BernoullisLawDerivationDiagram.svg is a vector version of this file. It should be used in place of this PNG file when not inferior.
File:BernoullisLawDerivationDiagram.png → File:BernoullisLawDerivationDiagram.svg
For more information, see Help:SVG. |
 |
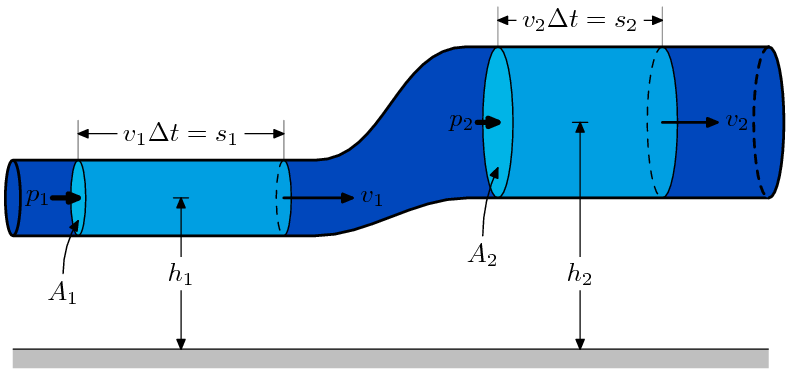
This is a diagram for one derivation of Bernoulli's Equation. I created this image using MetaPost; in order to produce the raster form, I compiled the source with MetaPost, embedded the resulting file in a pdfLaTeX document, viewed the PDF file with GSview (I tried Acrobat Reader, but its antialiasing was rather poor), and took a screen capture.
The MetaPost source code for this image is provided below (it is licensed under the same licenses as the image) in order to allow easy modification of the image. It's not particularly well-written code (one of my goals in creating it was to learn MetaPost), but anyone who might find it useful can try to make some use of it.
%%%%%%%%%%%%%%%%%%%%%%%%%%%%%%%%%%%%%%%%%%%%%%%%%%%%%%%%%%%%%%%%%%%%%%%%%%%%%%
%  bernoulli.mp                                                              %
%  A MetaPost diagram                                                        %
%  Created on 12 July 2005                                                   %
%  Copyright (c) 2005 by MannyMax                                            %
%  Some rights reserved; see accompanying information for details            %
%%%%%%%%%%%%%%%%%%%%%%%%%%%%%%%%%%%%%%%%%%%%%%%%%%%%%%%%%%%%%%%%%%%%%%%%%%%%%%

beginfig(1);

u := 1cm;
path t,b,m,pa[],pb[];
pair a[],b[];
picture alab[],blab[];
numeric lwidth,lheight,rwidth,rheight,tubelen,cpgap;
color backcol,chunkcol,capcol;

lwidth = 1u;
rwidth = 2u;
lheight= 2u;
rheight= 3u;
tubelen= 10u;
cpgap  = 1u;

%set diagram colors
backcol = 0.27734375*green + 0.73828125*blue;
chunkcol= 0.62500000*green + 0.88281250*blue;
capcol  = 0.70703125*green + 0.90234375*blue;

z0=(                0, lheight+(lwidth/2));
z4=((tubelen/2)-cpgap, lheight+(lwidth/2));
z5=((tubelen/2)+cpgap, rheight+(rwidth/2));
z1=(          tubelen, rheight+(rwidth/2));

z2=(                0, lheight-(lwidth/2));
z6=((tubelen/2)-cpgap, lheight-(lwidth/2));
z7=((tubelen/2)+cpgap, rheight-(rwidth/2));
z3=(          tubelen, rheight-(rwidth/2));

t=z0---z4..z5---z1;
b=z2---z6..z7---z3;
m=1/2[z0,z2]..1/2[z4,z6]..1/2[z5,z7]..1/2[z1,z3];

fill buildcycle(z0--z2,t,z1--z3,b) withcolor backcol;

fill unitsquare xscaled tubelen yscaled 0.25u shifted (0,-0.25u) withcolor 0.75*white;
linecap := butt;
draw (0,0)--(tubelen,0);
linecap := rounded;

%DRAW CHUNK A

a0=point(0.3) of t;
a1=point(0.8) of t;
a2=point(0.3) of b;
a3=point(0.8) of b;
pa1=buildcycle(a0--a2,t,a1--a3,b);

pa2 = fullcircle rotated 180 xscaled (0.2*lwidth) yscaled lwidth shifted 1/2[a0,a2];
pa3 = halfcircle rotated -90 xscaled (0.2*lwidth) yscaled lwidth shifted 1/2[a1,a3];
pa4 = halfcircle rotated  90 xscaled (0.2*lwidth) yscaled lwidth shifted 1/2[a1,a3];

pa5 = buildcycle(pa2,t,pa3,b);

fill pa2 withcolor capcol;
fill pa5 withcolor chunkcol;
draw pa2;
draw pa3;
draw pa4 dashed evenly;

a9 = center(buildcycle(pa4,pa3));
pa6 = a9--(a9+(a9-center(pa2))/3);
draw      pa6 cutafter  pa3 withpen pencircle scaled 1;
drawarrow pa6 cutbefore pa3 withpen pencircle scaled 1;
label.rt (btex $v_1$ etex, point(1) of pa6);

pa7 = (a2-(0.2u,0.5u)){dir(90)}..2/5[a2,center(pa2)];
drawarrow pa7;
label.bot(btex $A_1$ etex, point(0) of pa7);

a4 = whatever[a0,a3]=whatever[a1,a2];
a5 = (xpart(a4),0);
a6 = a5+(0,1u);
drawdblarrow a5--a4;
draw (a4-(0.1u,0))--(a4+(0.1u,0));
alab1 = thelabel(btex $h_1$ etex, (0,0));
unfill bbox alab1 shifted a6;
draw        alab1 shifted a6;

a11 = center(pa2);
a10 = a11+(a11-a9)/8;
drawarrow a10--a11 withpen pencircle scaled 2;
label.lft(btex $p_1$ etex, 1/4[a10,a11]);

a7 = a0 + (0,0.35u);
a8 = a1 + (0,0.35u);
draw a0--(a7 + (0,0.175u)) withcolor 0.5*white;
draw a1--(a8 + (0,0.175u)) withcolor 0.5*white;
drawdblarrow a7--a8;
alab2 =thelabel(btex $v_1\Delta t=s_1$ etex, (0,0));
unfill bbox alab2 shifted 1/2[a7,a8];
draw alab2 shifted 1/2[a7,a8];

%DRAW CHUNK B

b0=point(2.2) of t;
b1=point(2.6) of t;
b2=point(2.2) of b;
b3=point(2.6) of b;
pb1=buildcycle(b0--b2,t,b1--b3,b);
fill pb1 withcolor 0.6[blue,white];

pb2 = fullcircle rotated 180 xscaled (0.2*rwidth) yscaled rwidth shifted 1/2[b0,b2];
pb3 = halfcircle rotated -90 xscaled (0.2*rwidth) yscaled rwidth shifted 1/2[b1,b3];
pb4 = halfcircle rotated  90 xscaled (0.2*rwidth) yscaled rwidth shifted 1/2[b1,b3];

pb5 = buildcycle(pb2,t,pb3,b);

fill pb2 withcolor capcol;
fill pb5 withcolor chunkcol;
draw pb2;
draw pb3;
draw pb4 dashed evenly;

b9 = center(buildcycle(pb4,pb3));
pb6 = b9--(b9+(b9-center(pb2))/3);
draw      pb6 cutafter  pb3 withpen pencircle scaled 1;
drawarrow pb6 cutbefore pb3 withpen pencircle scaled 1;
label.rt (btex $v_2$ etex, point(1) of pb6);

pb7 = (b2-(0.2u,0.5u)){dir(90)}..2/5[b2,center(pb2)];
drawarrow pb7;
label.bot(btex $A_2$ etex, point(0) of pb7);

b4 = whatever[b0,b3]=whatever[b1,b2];
b5 = (xpart(b4),0);
b6 = b5+(0,1u);
drawdblarrow b5--b4;
draw (b4-(0.1u,0))--(b4+(0.1u,0));
blab1 = thelabel(btex $h_2$ etex, (0,0));
unfill bbox blab1 shifted b6;
draw        blab1 shifted b6;

b11 = center(pb2);
b10 = b11+(b11-b9)/8;
drawarrow b10--b11 withpen pencircle scaled 2;
label.lft(btex $p_2$ etex, 1/4[b10,b11]);

b7 = b0 + (0,0.35u);
b8 = b1 + (0,0.35u);
draw b0--(b7 + (0,0.175u)) withcolor 0.6*white;
draw b1--(b8 + (0,0.175u)) withcolor 0.6*white;
drawdblarrow b7--b8;
blab2 =thelabel(btex $v_2\Delta t=s_2$ etex, (0,0));
unfill bbox blab2 shifted 1/2[b7,b8];
draw blab2 shifted 1/2[b7,b8];

%DRAW FLUID TUBE

linecap := butt;

draw t withpen pencircle scaled 1;
draw b withpen pencircle scaled 1;

path acap,bcap,bcapa,bcapb;
acap  = fullcircle rotated 180 xscaled (0.2*lwidth) yscaled lwidth shifted 1/2[z0,z2];
bcapa = halfcircle rotated -90 xscaled (0.2*rwidth) yscaled rwidth shifted 1/2[z1,z3];
bcapb = halfcircle rotated  90 xscaled (0.2*rwidth) yscaled rwidth shifted 1/2[z1,z3];

bcap = buildcycle(bcapa,bcapb);

fill acap withcolor backcol;
fill bcap withcolor backcol;

linecap := rounded;

draw acap  withpen pencircle scaled 1;
draw bcapa withpen pencircle scaled 1;
draw bcapb withpen pencircle scaled 1 dashed evenly;

%uncomment the following line to draw a density symbol in the center of the figure
%label (btex $\rho$ etex, 1/2[point 1.5 of t, point 1.5 of b]);

endfig;

|
根據自由軟體基金會發佈嘅無固定段落、封面文字同封底文字GNU自由文件授權條款第1.2或打後嘅版本,你獲授權可以重製、散佈同埋修改爾份文件。授權條款嘅副本喺章節GNU自由文件授權條款。 |
| 呢個檔案用共享創意 姓名標示-非商業性-相同方式分享3.0 未本地化版本條款授權。 | ||
| ||
| This licensing tag was added to this file as part of the GFDL licensing update. |
- 你可以:
- 去分享 – 複製、發佈同傳播呢個作品
- 再改 – 創作演繹作品
- 要遵照下面嘅條件:
- 署名 – 你一定要畀合適嘅表彰、畀返指向呢個授權條款嘅連結,同埋寫明有無改過嚟。你可以用任何合理方式去做,但唔可以用任何方式暗示授權人認可咗你或者你嘅使用方式。
- 相同方式分享 – 如果你用任何方式改過呢個作品,你必須要用返原本或者相似嘅條款發佈。
檔案歷史
撳個日期/時間去睇響嗰個時間出現過嘅檔案。
| 日期/時間 | 縮圖 | 尺寸 | 用戶 | 註解 | |
|---|---|---|---|---|---|
| 現時 | 2005年7月13號 (三) 03:37 | | 790 × 370(9 KB) | MannyMax~commonswiki | {{GFDL}} {{cc-by-sa-2.5}} |
檔案用途
以下嘅1版用到呢個檔:
全域檔案使用情況
下面嘅維基都用緊呢個檔案:
- anp.wikipedia.org嘅使用情況
- ar.wikipedia.org嘅使用情況
- az.wikipedia.org嘅使用情況
- bs.wikipedia.org嘅使用情況
- Isaac Newton
- Blaise Pascal
- Robert Hooke
- Augustin Louis Cauchy
- Potisak
- Leonhard Euler
- Robert Boyle
- Mehanika fluida
- Hookeov zakon
- Joseph Louis Gay-Lussac
- Šablon:Mehanika kontinuuma
- Mehanika čvrstih tijela
- Viskoznost
- Statika fluida
- Mehanički napon
- Bernoullijeva jednačina
- Dinamika fluida
- Fluid
- Daniel Bernoulli
- Zakon održanja mase
- Deformacija (mehanika)
- Navier–Stokesove jednačine
- Claude-Louis Navier
- George Gabriel Stokes
- Hagen–Poiseuilleova jednačina
- Njutnovski fluid
- Savijanje
- Elastičnost (fizika)
- Čvrsto stanje
- Mehanika kontinuuma
- ca.wikipedia.org嘅使用情況
- cs.wikipedia.org嘅使用情況
- da.wikipedia.org嘅使用情況
- de.wikipedia.org嘅使用情況
- en.wikipedia.org嘅使用情況
- en.wikiversity.org嘅使用情況
睇呢個檔案嘅更多全域使用情況。