
File:Michelsonmorley-boxplot.svg

原本檔案 (SVG檔案,表面大細: 432 × 432 像素,檔案大細:11 KB)
摘要
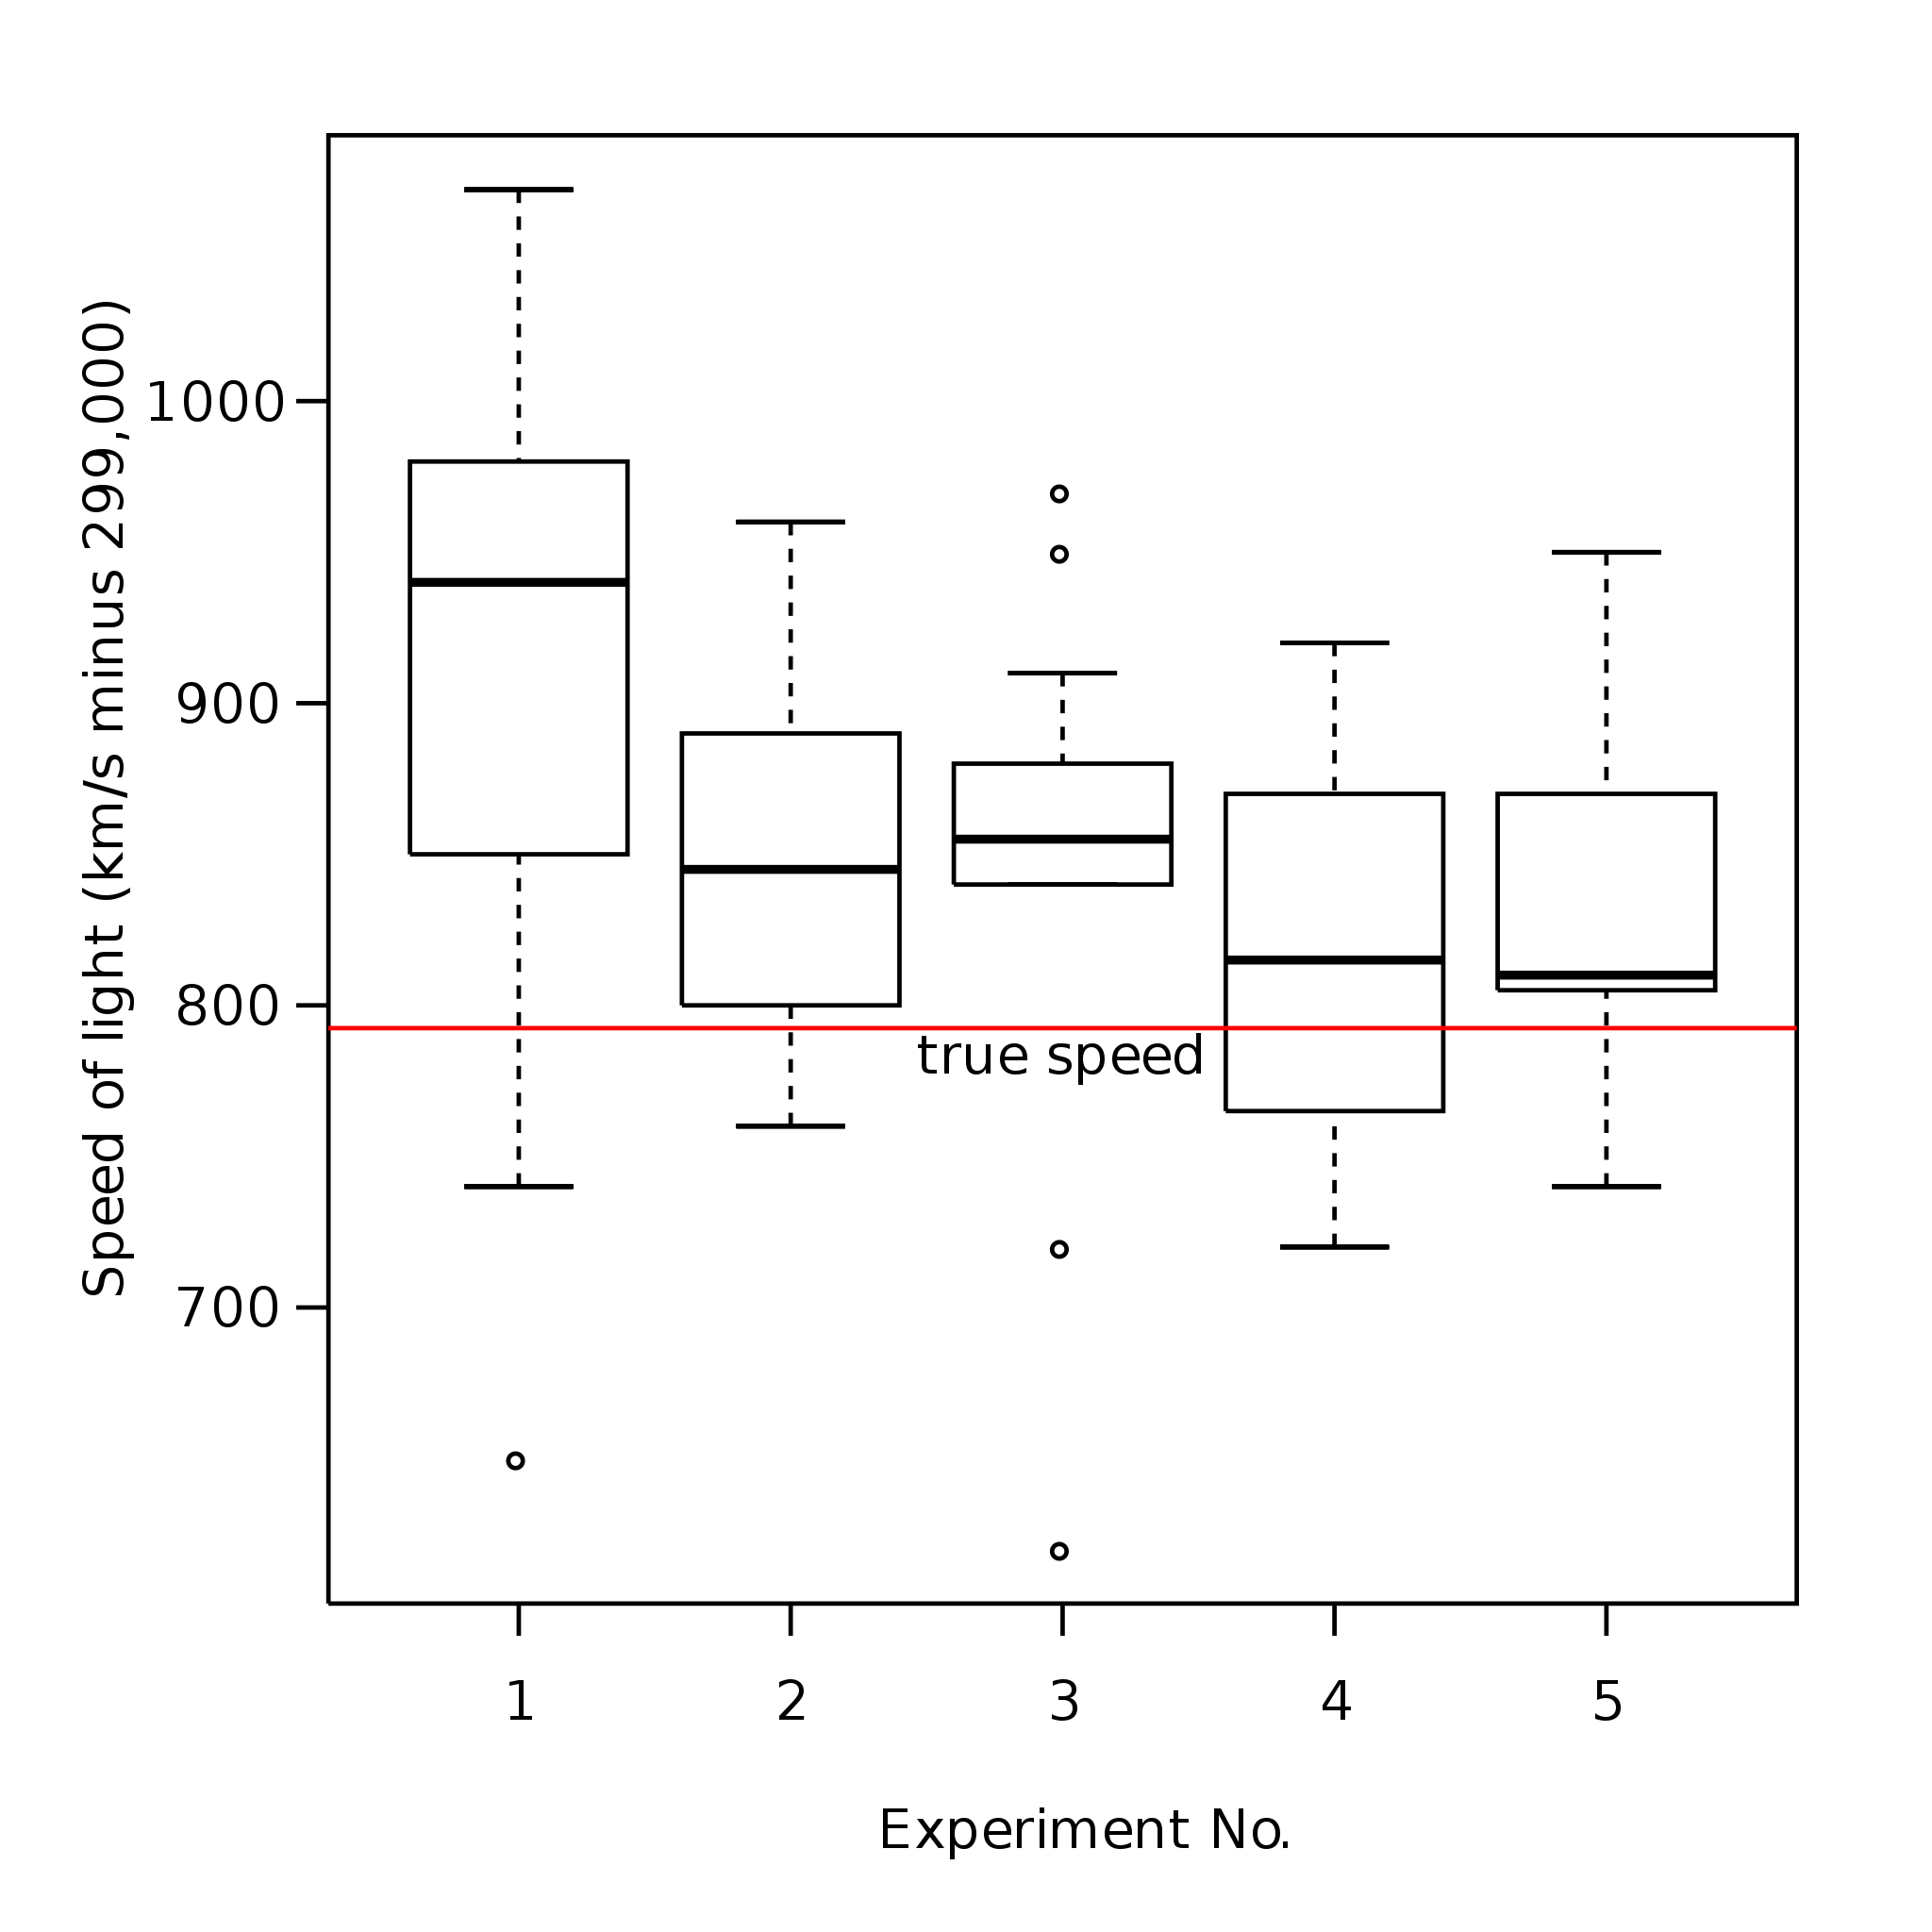
| 描述 | Boxplot representing Michelson's data on the speed of light. It consists of five experiments, each made of 20 consecutive runs. |
| 日期 | |
| 來源 | 自己作品 |
| 作者 | User:Schutz |
| SVG genesis |
This data is not from the Michelson-Morley experiment but from Michelson's measurement of the speed of light. See MICHELSON, A. A. (1882). Experimental determination of the velocity of light made at the United States Naval Academy, Annapolis. Astronomic Papers 1 pp. 109-145 U.S. Nautical Almanac Office, or S. M. Stigler (1977) Do robust estimators work with real data? Annals of Statistics 5, 1055–1098.
Original upload by User:Schutz
Boxplot representing Michelson's data on the speed of light. It consists of five experiments, each made of 20 consecutive runs. Note that the oblique line is incorrect, and probably due to a bug in the Mediawiki software/SVG converter. The graphic was created by User:Schutz for Wikipedia on 28 December 2006, using the R statistical project. The program that generated the graphic is given below; the data and the idea are from the R help page for the morley dataset (see help(morley)). The graph was exported in postscript format, converted to SVG using the pstoedit command, and the layout was slightly modified using Inkscape before upload.
  data(morley)
  morley$Expt <- factor(morley$Expt)
  morley$Run <- factor(morley$Run)
  attach(morley)

  postscript("Michelsonmorley-boxplot.ps", paper="special", height=6, width=6,
             horizontal=F)
  par(las=1)
  par(mar=c(5.1, 5.1, 2.1, 2.1))
  par(font=2)
  par(font.axis=2)
  boxplot(Speed ~ Expt, xlab = "Experiment No.", ylab="Speed of light (km/s minus 299,000)")
  abline(h=792.458, lty=3)
  dev.off()
New upload by User:Mwtoews
Boxplot representing Michelson's data on the speed of light. It consists of five experiments, each made of 20 consecutive runs.
The graphic was originally created by User:Schutz for Wikipedia on 28 December 2006, using the R statistical project. The program that generated the graphic is given below; the data and the idea are from the R help page for the morley dataset (see help(morley)). The graph was exported in PDF format, converted to SVG using Adobe Illustrator, and the layout was slightly modified using Vim before upload.
data(morley)
morley$Expt <- factor(morley$Expt)

pdf("Michelsonmorley-boxplot.pdf", height=6, width=6)
par(las=1, mar=c(5.1, 5.1, 2.1, 2.1))
boxplot(Speed ~ Expt, morley, xlab = "Experiment No.",
        ylab="Speed of light (km/s minus 299,000)")
abline(h=792.458, col="red")
text(3,792.458,"true\nspeed")
dev.off()
協議
| I, the copyright holder of this work, release this work into the public domain. This applies worldwide. In some countries this may not be legally possible; if so: I grant anyone the right to use this work for any purpose, without any conditions, unless such conditions are required by law. |
The creator and uploader also believes that this graphic is a trivial work which does not qualify for copyright.
Reference
- A. J. Weekes (1986) A Genstat Primer. London: Edward Arnold.
檔案歷史
撳個日期/時間去睇響嗰個時間出現過嘅檔案。
| 日期/時間 | 縮圖 | 尺寸 | 用戶 | 註解 | |
|---|---|---|---|---|---|
| 現時 | 2008年5月3號 (六) 10:25 | | 432 × 432(11 KB) | Papa November | rm opaque bg. No copyright claimed for non-creative derivative work. |
| 2007年10月30號 (二) 21:30 |  | 432 × 432(11 KB) | Mwtoews | ||
| 2007年10月30號 (二) 21:27 |  | 432 × 432(11 KB) | Mwtoews | ||
| 2007年10月30號 (二) 21:24 |  | 432 × 432(12 KB) | Mwtoews | ||
| 2006年12月28號 (四) 18:43 |  | 720 × 720(19 KB) | Schutz |
檔案用途
全域檔案使用情況
下面嘅維基都用緊呢個檔案:
- ar.wikipedia.org嘅使用情況
- ca.wikipedia.org嘅使用情況
- cs.wikipedia.org嘅使用情況
- cy.wikipedia.org嘅使用情況
- da.wikipedia.org嘅使用情況
- el.wiktionary.org嘅使用情況
- en.wikipedia.org嘅使用情況
- Summary statistics
- User:Rp
- Outlier
- Box plot
- Chart
- User:Andrevan
- User:Guaka
- User:M.e
- User:Jyril
- User:Peak Freak
- User:TMA~enwiki
- User:Val42
- User:Dreish
- User:Astronouth7303
- User:FuzzyBunny
- User:Wendell
- User:Kelisi
- User:Salix alba
- User:MichaelCaricofe
- User:NeonMerlin/boxes
- User:Kazikameuk
- User:Commander Nemet
- User:Emilio floris
- User:Burwellian
- User:Physicistjedi
- User:Bayerischermann
- User:Calilasseia
- User:ChildOfTheMoon83
- User:Hibernian
- User:Jcbarr
- User:Llewdor
- User:Richfife
- User:KnowledgeLord
- Data and information visualization
- Wikipedia:Userboxes/Mathematics
- User:Blarneytherinosaur/Userboxes
- User:Whitetigah
- User:TheObtuseAngleOfDoom/Userbox
- User:Estreya
- User:Faya/Userboxes
- User:Thistheman
- User:Rachel Ayres
- User:Drummmer42
睇呢個檔案嘅更多全域使用情況。