
File:Negative and positive skew diagrams (English).svg

呢個「SVG」檔案嘅呢個「PNG」預覽嘅大細:446 × 159 像素。 第啲解像度:320 × 114 像素|640 × 228 像素|1,024 × 365 像素|1,280 × 456 像素|2,560 × 913 像素。
原本檔案 (SVG檔案,表面大細: 446 × 159 像素,檔案大細:4 KB)
.svg?uselang=yue)
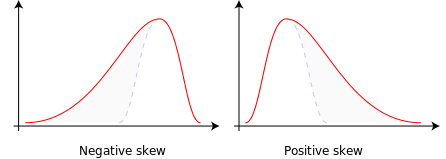
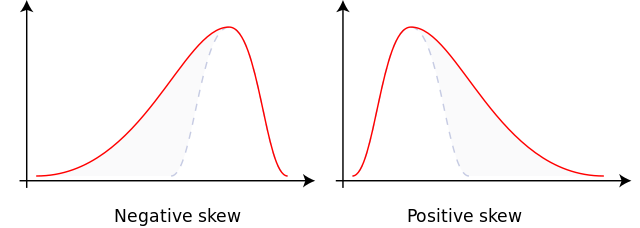
Guide for understanding negative/positive skewness
摘要
| 描述 |
English: Diagrams illustrating negative and positive skew. (Created with Inkscape, an Open Source software, and based on the previous PNG version en:File:Skew.png with the text removed.) |
| 日期 | 2008年8月16號 (original upload date). |
| 來源 | 自己作品; transferred from en.wikipedia by Rodolfo Hermans (Godot). |
| 作者 | Rodolfo Hermans (Godot) at en.wikipedia. |
| Other versions |
[]
|
協議
我,呢份作品嘅作者,決定用以下許可發佈呢件作品:
呢個檔案用共享創意 姓名標示-非商業性-相同方式分享3.0 未本地化版本條款授權。
- 你可以:
- 去分享 – 複製、發佈同傳播呢個作品
- 再改 – 創作演繹作品
- 要遵照下面嘅條件:
- 署名 – 你一定要畀合適嘅表彰、畀返指向呢個授權條款嘅連結,同埋寫明有無改過嚟。你可以用任何合理方式去做,但唔可以用任何方式暗示授權人認可咗你或者你嘅使用方式。
- 相同方式分享 – 如果你用任何方式改過呢個作品,你必須要用返原本或者相似嘅條款發佈。
檔案歷史
撳個日期/時間去睇響嗰個時間出現過嘅檔案。
| 日期/時間 | 縮圖 | 尺寸 | 用戶 | 註解 | |
|---|---|---|---|---|---|
| 現時 | 2023年10月2號 (一) 17:41 | 446 × 159(4 KB) | Nyq | lc common nouns | |
| 2008年8月16號 (六) 02:22 | 446 × 159(4 KB) | Rodolfo Hermans | {{Information |Description= |Source= |Date= |Author= |Permission= |other_versions= }} Category:Graphs Category:Probability theory Category:Statistical deviation and dispersion | ||
| 2008年8月16號 (六) 01:43 | 446 × 159(32 KB) | Rodolfo Hermans | {{Information |Description=Graph showing two asymetric distributions with negative and positive Skeness (Statistics). |Source= |Date= |Author=Rodolfo Hermans |Permission= |other_versions= }} Category:Graphs Category:Statistics | ||
| 2008年8月16號 (六) 01:28 | 446 × 159(4 KB) | Rodolfo Hermans | {{Information |Description={{en|Author: Rodolfo Hermans I created this image using Inkscale, an open source software, and based on the previous PNG version en::Image:Skew.png. Removed text. Godot ([[:en:User talk:Rodolfo |
檔案用途
全域檔案使用情況
下面嘅維基都用緊呢個檔案:
- ar.wikipedia.org嘅使用情況
- be.wikipedia.org嘅使用情況
- ca.wikipedia.org嘅使用情況
- en.wikipedia.org嘅使用情況
- en.wikibooks.org嘅使用情況
- en.wikiversity.org嘅使用情況
- eu.wikipedia.org嘅使用情況
- fa.wikipedia.org嘅使用情況
- fi.wikipedia.org嘅使用情況
- fr.wikipedia.org嘅使用情況
- he.wikipedia.org嘅使用情況
- hi.wikipedia.org嘅使用情況
- kn.wikipedia.org嘅使用情況
- ko.wikipedia.org嘅使用情況
- nl.wikipedia.org嘅使用情況
- no.wikipedia.org嘅使用情況
- pt.wikipedia.org嘅使用情況
- sq.wikipedia.org嘅使用情況
- sr.wikipedia.org嘅使用情況
- ta.wikipedia.org嘅使用情況
- tr.wikipedia.org嘅使用情況
- uk.wikipedia.org嘅使用情況
- vi.wikipedia.org嘅使用情況
- www.wikidata.org嘅使用情況
- zh.wikipedia.org嘅使用情況
.svg)