
File:Scatter plot.jpg
冇更高解像度嘅圖像。
Scatter_plot.jpg (500 × 500 像素,檔案大細:40 KB ,MIME類型:image/jpeg)
摘要
| 描述 |
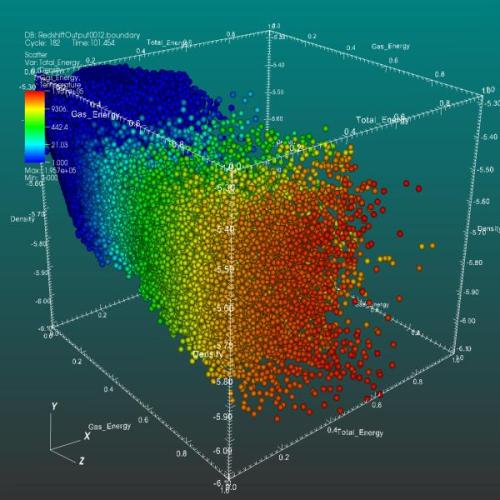
English: Scatter plot
VisIt's Scatter plot allows for the visualization of multivariate data of up to four dimensions. The Scatter plot takes multiple scalar variables and uses them for different axes in phase space. The different variables are combined to form coordinates in the phase space and they are displayed using glyphs and colored using another scalar variable. |
| 日期 | Updated: November 8, 2007 |
| 來源 | Visualizations that have been created with VisIt. at wci.llnl.gov |
| 作者 | UCRL |


協議
This work is in the public domain in the United States because it is a work prepared by an officer or employee of the United States Government as part of that person’s official duties under the terms of Title 17, Chapter 1, Section 105 of the US Code.
Note: This only applies to original works of the Federal Government and not to the work of any individual U.S. state, territory, commonwealth, county, municipality, or any other subdivision. This template also does not apply to postage stamp designs published by the United States Postal Service since 1978. (See § 313.6(C)(1) of Compendium of U.S. Copyright Office Practices). It also does not apply to certain US coins; see The US Mint Terms of Use.
|
 | |
| This file has been identified as being free of known restrictions under copyright law, including all related and neighboring rights. | ||
檔案歷史
撳個日期/時間去睇響嗰個時間出現過嘅檔案。
| 日期/時間 | 縮圖 | 尺寸 | 用戶 | 註解 | |
|---|---|---|---|---|---|
| 現時 | 2008年7月10號 (四) 22:34 | | 500 × 500(40 KB) | Mdd | {{Information |Description={{en|1=Scatter plot VisIt's Scatter plot allows you to visualize multivariate data of up to four dimensions. The Scatter plot takes multiple scalar variables and uses them for different axes in phase space. The different variab |
檔案用途
無嘢連來呢份檔案。
全域檔案使用情況
下面嘅維基都用緊呢個檔案:
- ar.wikipedia.org嘅使用情況
- bn.wikipedia.org嘅使用情況
- ca.wikipedia.org嘅使用情況
- de.wikipedia.org嘅使用情況
- en.wikipedia.org嘅使用情況
- en.wikiversity.org嘅使用情況
- et.wikipedia.org嘅使用情況
- eu.wikipedia.org嘅使用情況
- fa.wikipedia.org嘅使用情況
- gl.wikipedia.org嘅使用情況
- id.wikipedia.org嘅使用情況
- it.wikipedia.org嘅使用情況
- ja.wikipedia.org嘅使用情況
- pt.wikipedia.org嘅使用情況
- ro.wikipedia.org嘅使用情況
- ru.wikipedia.org嘅使用情況
- simple.wikipedia.org嘅使用情況
- sl.wikipedia.org嘅使用情況
- sr.wikipedia.org嘅使用情況
- sv.wikipedia.org嘅使用情況
- uk.wikipedia.org嘅使用情況
- zh.wikipedia.org嘅使用情況