
File:Standard deviation diagram.svg

呢個「SVG」檔案嘅呢個「PNG」預覽嘅大細:400 × 200 像素。 第啲解像度:320 × 160 像素|640 × 320 像素|1,024 × 512 像素|1,280 × 640 像素|2,560 × 1,280 像素。
原本檔案 (SVG檔案,表面大細: 400 × 200 像素,檔案大細:17 KB)
摘要
| 描述 |
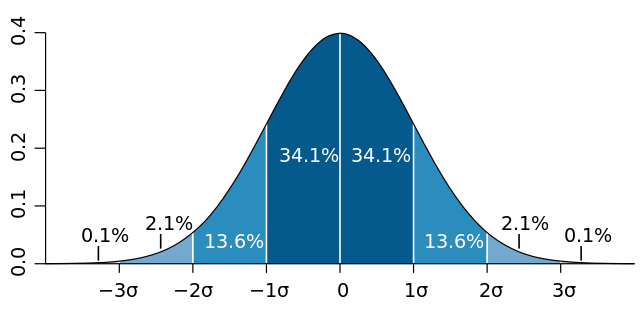
English: Normal distribution curve that illustrates standard deviations. Each band has 1 standard deviation, and the labels indicate the approximate proportion of area (note: these add up to 99.8%, and not 100% because of rounding for presentation.)
Français : Courbe de distribution normale montrant l'écart type. Chaque bande verticale a une largeur d'un écart type et les pourcentages indiquent leur valeur approximative rapportée à la population totale. Note : du fait des arrondis, le total est de 99,8 % au lieu de 100%. |
| 日期 | |
| 來源 | 自己作品, based (in concept) on figure by Jeremy Kemp, on 2005-02-09 |
| 作者 | M. W. Toews |
| Other versions |
|
.svg)
協議
Ĉi tiu dosiero estas disponebla laŭ la permesilo Krea Komunaĵo Atribuite 2.5 Ĝenerala.
- 你可以:
- 去分享 – 複製、發佈同傳播呢個作品
- 再改 – 創作演繹作品
- 要遵照下面嘅條件:
- 署名 – 你一定要畀合適嘅表彰、畀返指向呢個授權條款嘅連結,同埋寫明有無改過嚟。你可以用任何合理方式去做,但唔可以用任何方式暗示授權人認可咗你或者你嘅使用方式。
檔案歷史
撳個日期/時間去睇響嗰個時間出現過嘅檔案。
| 日期/時間 | 縮圖 | 尺寸 | 用戶 | 註解 | |
|---|---|---|---|---|---|
| 現時 | 2015年1月15號 (四) 02:06 | | 400 × 200(17 KB) | GliderMaven | Average is now zero not mu |
| 2007年4月7號 (六) 11:08 |  | 400 × 200(14 KB) | Petter Strandmark | == Summary == Standard deviation diagram, based an original graph by Jeremy Kemp, in 2005-02-09 [http://pbeirne.com/Programming/gaussian.ps]. This figure was started in R using: <pre> x <- seq(-4,4,.1) plot(x,dnorm(x),type |
檔案用途
全域檔案使用情況
下面嘅維基都用緊呢個檔案:
- af.wikipedia.org嘅使用情況
- ar.wikipedia.org嘅使用情況
- ast.wikipedia.org嘅使用情況
- as.wikipedia.org嘅使用情況
- ba.wikipedia.org嘅使用情況
- be-tarask.wikipedia.org嘅使用情況
- bg.wikipedia.org嘅使用情況
- bn.wikipedia.org嘅使用情況
- bs.wikipedia.org嘅使用情況
- ca.wikipedia.org嘅使用情況
- cbk-zam.wikipedia.org嘅使用情況
- cs.wikipedia.org嘅使用情況
- cv.wikipedia.org嘅使用情況
- cy.wikipedia.org嘅使用情況
- dag.wikipedia.org嘅使用情況
- da.wikipedia.org嘅使用情況
- de.wikipedia.org嘅使用情況
- de.wikiversity.org嘅使用情況
- el.wikipedia.org嘅使用情況
- en.wikipedia.org嘅使用情況
睇呢個檔案嘅更多全域使用情況。