
File:Pi 30K.gif
冇更高解像度嘅圖像。
Pi_30K.gif (500 × 500 像素,檔案大細:476 KB ,MIME類型:image/gif、循環、10格、2.0 s)
摘要
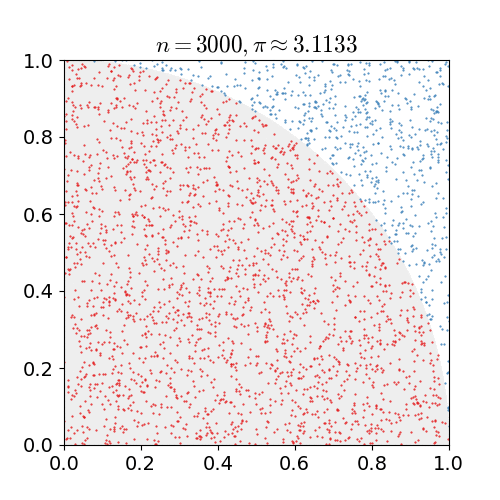
This plot was created with Matplotlib.
| 描述 |
English: As points are randomly scattered inside the unit square, some fall within the unit circle. The fraction of points inside the circle over all points approaches pi/4 as the number of points goes toward infinity. This animation represents this method of computing pi out to 30,000 iterations. |
| 來源 | 自己作品 |
| 作者 | nicoguaro |
| 原始碼 | Python codefrom __future__ import division
import numpy as np
import matplotlib.pyplot as plt
import matplotlib.patches as mpatches
import matplotlib.animation as animation
from matplotlib import rcParams
# In Windows the next line should provide the full path to convert.exe
# since convert is a Windows command
#rcParams['animation.convert_path'] = "C:\Program Files\ImageMagick-6.9.3\convert.exe"
rcParams['mathtext.fontset'] = 'cm'
rcParams['font.size'] = 14
red = "#e41a1c"
blue = "#377eb8"
gray = "#eeeeee"
def update(n):
ax.cla()
pts = np.random.uniform(low=0, high=1, size=(2, n))
circ = pts[:, pts[0, :]**2 + pts[1, :]**2 <= 1]
out_circ = pts[:, pts[0, :]**2 + pts[1, :]**2 > 1]
pi_approx = 4*circ.shape[1]/n
circle = mpatches.Wedge((0, 0), 1, 0, 90, color=gray)
ax.add_artist(circle)
plt.plot(circ[0, :], circ[1, :], marker='.', markersize=1,
linewidth=0, color=red)
plt.plot(out_circ[0, :], out_circ[1, :], marker='.',markersize=1,
linewidth=0, color=blue)
plt.title(r"$n = {}, \pi \approx {:.4f}$".format(n, pi_approx))
plt.axis("square")
plt.xlim(0, 1)
plt.ylim(0, 1)
nvec = np.round(np.logspace(2, 5, 10))
nvec = [3000, 4000, 5000, 6500, 8500, 10000, 15000, 18000, 24000, 30000]
fig = plt.figure(figsize=(5, 5))
ax = fig.add_subplot(111)
ani = animation.FuncAnimation(fig, update, frames=nvec, blit=False)
ani.save("monte_carlo_pi.gif", writer='imagemagick',
savefig_kwargs={'delay': 6})
|
協議
我,呢份作品嘅作者,決定用以下許可發佈呢件作品:
Ĉi tiu dosiero estas disponebla laŭ la permesilo Krea Komunaĵo Atribuite 3.0 Neadaptita.
- 你可以:
- 去分享 – 複製、發佈同傳播呢個作品
- 再改 – 創作演繹作品
- 要遵照下面嘅條件:
- 署名 – 你一定要畀合適嘅表彰、畀返指向呢個授權條款嘅連結,同埋寫明有無改過嚟。你可以用任何合理方式去做,但唔可以用任何方式暗示授權人認可咗你或者你嘅使用方式。
檔案歷史
撳個日期/時間去睇響嗰個時間出現過嘅檔案。
| 日期/時間 | 縮圖 | 尺寸 | 用戶 | 註解 | |
|---|---|---|---|---|---|
| 現時 | 2017年2月16號 (四) 16:00 | | 500 × 500(476 KB) | Nicoguaro | Make the plot square and increase gif delay. |
| 2017年2月16號 (四) 15:38 |  | 640 × 480(476 KB) | Nicoguaro | Bigger text in the axes, and colors from ColorBrewer. Code in Python. | |
| 2011年11月7號 (一) 18:29 |  | 500 × 500(373 KB) | Rayhem | Slowed animation to avoid looking like a blinky page element, improved resolution, added counter for number of points, shaded points inside/outside the circle. ==Mathematica 7.0 Source== <pre> tinyColor[color_, point_] := {PointSize[Small], color, Point[ | |
| 2011年3月14號 (一) 23:12 |  | 360 × 369(363 KB) | CaitlinJo | {{Information |Description ={{en|1=As points are randomly scattered inside the unit square, some fall within the unit circle. The fraction of points inside the circle over all points approaches pi as the number of points goes toward infinity. This ani |
檔案用途
全域檔案使用情況
下面嘅維基都用緊呢個檔案:
- ar.wikipedia.org嘅使用情況
- be.wikipedia.org嘅使用情況
- bg.wikipedia.org嘅使用情況
- ca.wikipedia.org嘅使用情況
- da.wikipedia.org嘅使用情況
- el.wikipedia.org嘅使用情況
- en.wikipedia.org嘅使用情況
- en.wikibooks.org嘅使用情況
- eo.wikipedia.org嘅使用情況
- eu.wikipedia.org嘅使用情況
- fa.wikipedia.org嘅使用情況
- fr.wikipedia.org嘅使用情況
- he.wikipedia.org嘅使用情況
- hi.wikipedia.org嘅使用情況
- id.wikipedia.org嘅使用情況
- it.wikipedia.org嘅使用情況
- ja.wikipedia.org嘅使用情況
- ko.wikipedia.org嘅使用情況
- pt.wikipedia.org嘅使用情況
- sh.wikipedia.org嘅使用情況
- simple.wikipedia.org嘅使用情況
- sl.wikipedia.org嘅使用情況
- sr.wikipedia.org嘅使用情況
- sv.wikipedia.org嘅使用情況
- ta.wikipedia.org嘅使用情況
- test.wikipedia.org嘅使用情況
- tr.wikipedia.org嘅使用情況
- uk.wikipedia.org嘅使用情況
- vi.wikipedia.org嘅使用情況
- www.wikidata.org嘅使用情況
- zh.wikipedia.org嘅使用情況